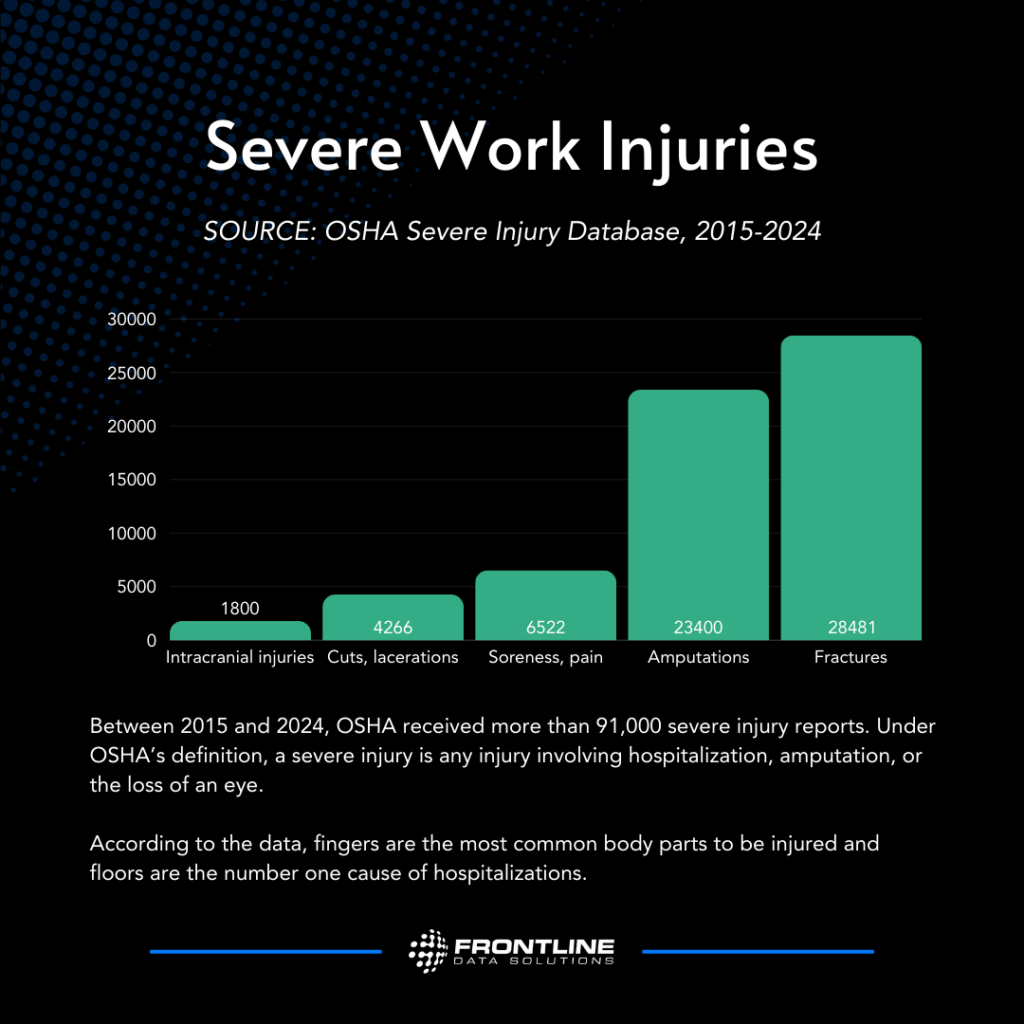
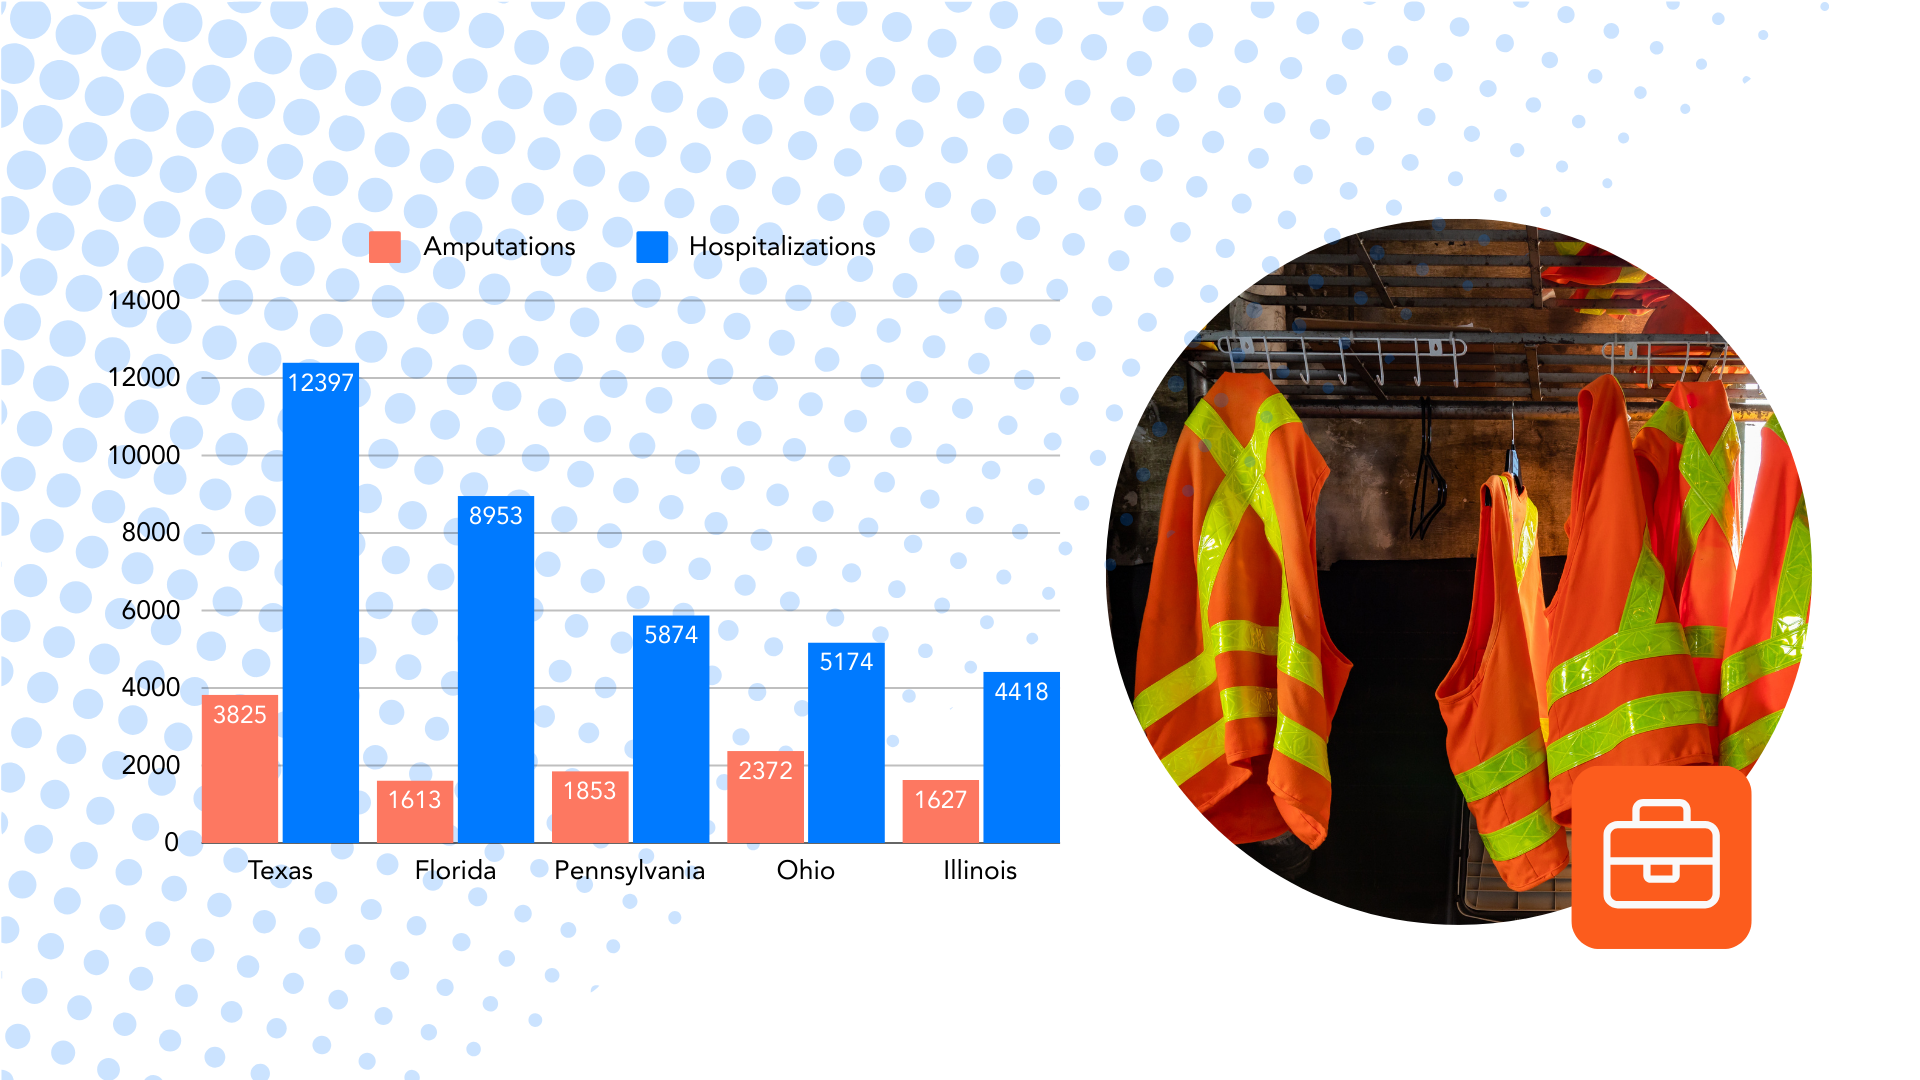
Between 2015 and 2024, there were 91,153 severe injuries reported to OSHA. After analyzing the data, we found the 5 states who have submitted the most severe injuries in the past decade. Did your state make the list? Read our report to find out!
OSHA’s severe injury definition
In January 2015, OSHA implemented a requirement for employers to report all severe workplace injuries. Any injury that meets at least one of the following criteria is considered severe:
- Loss of an eye
- Limb amputation
- Hospitalization
Between 2015 and 2024, OSHA has collected thousands of incidents in its severe injury report database.
States with the most severe injuries
Texas
Florida
Pennsylvania
Ohio
Illinois
According to OSHA’s database, the five states with the most severe injury reports submitted since 2015 are Texas, Florida, Pennsylvania, Ohio, and Illinois. Rounding out the top 10 are Georgia, New York, Wisconsin, Alabama, and Colorado.
The states with the fewest severe injury reports are:
- Vermont
- Wyoming
- Iowa
- Indiana
- Nevada
It’s important to note that these rankings are based purely on the total number of injuries reported. With added context, it’s not as obvious which are the most dangerous states in the U.S. for workers.
What’s driving these rankings?
From weather and security measures to employee training and PPE use, there are many variables that influence workplace safety. That’s why context is so important when analyzing raw OSHA datasets. While Texas, Florida, Pennsylvania, Ohio, and Illinois have the highest number of severe injuries, there are a few factors influencing those rankings.
Population density
OSHA’s dataset includes every severe injury report they receive from employers. So, when you view the raw data, it’s no surprise that population is the number one factor driving severe injury rankings.
All 5 of the top states for severe injuries (*) are within the top 10 U.S. states by population size:
- California (39.5M)
- Texas (29.1M)*
- Florida (21.5M)*
- New York (20.2M)
- Pennsylvania (13M)*
- Illinois (12.8M)*
- Ohio (11.8M)*
- Georgia (10.7M)
- North Carolina (10.4M)
- Michigan (10M)
One of the biggest surprises is that California, the state with the largest population by far, ranks 27th for most severe injuries reported to OSHA. However, there’s a critical piece of information missing:
Most employers in California report severe injuries to Cal/OSHA, not the federal agency.
Additionally, some employers fall outside of Cal/OSHA’s jurisdiction These include USPS employees and contractors, U.S. government employees, employers in the maritime industry, and private sector employers operating at national parks, military installations, and similar locations.
Between 2015 and 2024, OSHA received 467 injury reports from California-based employers. Moreover, most of these incidents came from unique industries such as casinos, international affairs, marine cargo handling, correctional institutions, and the postal service.
91,145
24,190
74,327
Dangerous work environments
Another major factor to consider is the leading industry in each state. In Texas, for example, oil and gas is by far the most dominant sector—and it’s also notoriously dangerous, accounting for more than 1,300 hospitalizations since 2015.
Moreover, in New York, finance and insurance is the biggest industry. When you compare your state to other states, make sure you’re factoring in the risk level of the top industries. Not all work environments are created equally, and some jobs come with a higher likelihood of injury to begin with.
Industry breakdown
In OSHA’s severe injury database, the worst industries for amputations are:
- General Medical and Surgical Hospitals
- Supermarkets and Other Grocery Retailers (except Convenience Retailers)
- Poultry Processing
- All Other Plastics Product Manufacturing
- Sawmills
The worst industries for hospitalizations are:
- General Medical and Surgical Hospitals
- Electrical Contractors and Other Wiring Installation Contractors
- Commercial and Institutional Building Construction
- Supermarkets and Other Grocery Retailers (except Convenience Retailers)
- Support Activities for Oil and Gas Operations
When we look at the data by industry, the rankings change significantly. Take the most dangerous industry, General Medical and Surgical Hospitals, as an example. If you look at just those incidents by location, Texas, North Dakota, and Oklahoma have the most severe injuries. In other words, those states are more dangerous for hospital workers and contractors.
To begin with, this is an important reminder that context is key when it comes to health and safety. Moreover, OSHA’s data includes many fields you can use to better understand severe incident risks in your state. In particular, industry, zip code, body part, and source are just some of the criteria available.
Most severe injury details
When creating a strategy for injury prevention, there are some other key insights you can look for in the severe injury database.

Body parts affected
The most common body parts that get amputated in severe incidents are fingertips. In fact, fingers, thumbs, toes, and hands make up the majority of amputations regardless of state.
Basically, other common body parts involved in serious injuries include:
- Legs
- Brain
- Hips
- Ankles
- Chest
To begin with, every company should have a safety program that reflects the dangers within its processes. For instance, if hip injuries are common in your industry, then you should create a training module to educate employees on the ways they might sustain this type of injury. Finally, you can find the top injuries in your state or industry by filtering through the OSHA dataset..
Causes of most severe injuries
OSHA also collects detailed information on the sources of severe workplace injuries. In particular, across all states, machinery (unspecified) ranks as the leading cause of amputations. Meanwhile, floors represent the top source of hospitalization injuries. In addition, other frequent sources include pallet jacks, semi-trucks, tractor-trailers, tanker trucks, ladders, stepladders, and roofs.
Interestingly, Texas stands out as the only state where forklifts are the leading cause of severe injuries. However, for the remaining states in the top five, “floors” remain the primary source of injury. This is mostly due to slip, trip, and fall incidents.
Preventing most severe injuries
In particular, OSHA’s severe injury database is full of information that you can use to prevent injuries at your company. Even if your state doesn’t appear on the list of the most dangerous states, you still need to stay vigilant. Therefore, filtering for your state and NAICS code (industry) and organizing the data by zip code, injury type, or primary cause is a great way to assess the risk level of your operation. Furthermore, reviewing the incident descriptions can give you ideas for safety training topics, preventive control measures, and other improvement opportunities.
Anticipating risks and preventing incidents can be hard if you don’t have much internal data to work with. Therefore, supplementing your near-miss and hazard reports with OSHA’s severe injury database is a smart and proactive safety strategy. Moreover, the more you understand about injury risks in your state and industry, the better prepared you’ll be to protect workers onsite.


